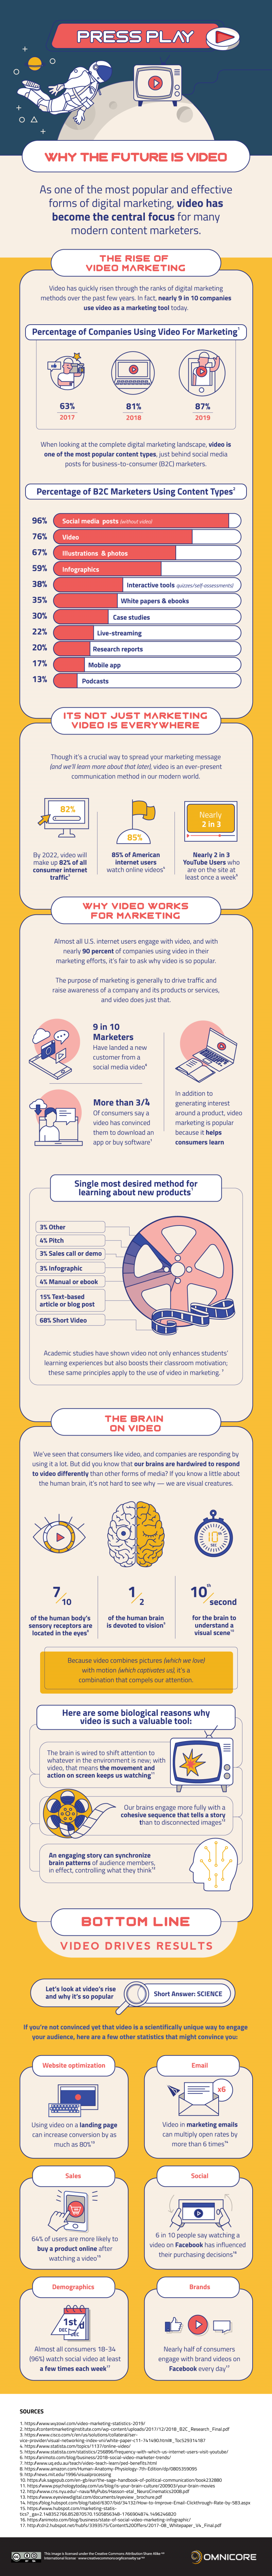
Here’s an infographic chock full of video marketing statistics you can use to argue your need for a bigger video marketing budget. Candidly, I’m not a big fan of infographics. Too many cite numbers that are unverifiable (like the 7-second attention span of a goldfish), or questionable sources (like other infographics).
But this one, from digital healthcare agency Omnicore appears to be responsibly sourced for the most part. I don’t recommend telling your boss that “a website with a video is 53 times more likely to end up on Google’s front page.” If only! While it’s true that Forrester reported this — in 2008 — they’ve long-since disclaimed it.
Here are some points relevant to technology solution sales and marketing videos you might slip into your next video budget meeting. You might also be interested in video marketing statistics previously discussed on this blog, including What types of videos can influence B2B buying decisions?
Video marketing statistics relevant to technology solutions
- 59% of executives prefer video to text. (Wordstream)
- People spend 2.6x more time on pages that have videos. (Wistia)
- 23% of marketers use Interactive videos. (Wyzowl)
- Social media posts with video have 48% more views. (Hubspot)
- Compared to YouTube links, Facebook’s native videos have 10x higher reach. (Socialbakers)
- LinkedIn video campaigns receive view rates of 50%. (Linkedin)
- 84% of marketers say that using videos on LinkedIn has been successful. (Smart Insights)